
Early solar generation statistics
Looking at the first 60 days of my solar panel usage.

Back in June I had solar panels installed and I've been tracking the electricity generation ever since. As I commented in my earlier blog post, watching the generation graphs can be quite addictive but the really interesting thing is looking at the data in more detail.
Recap of my setup
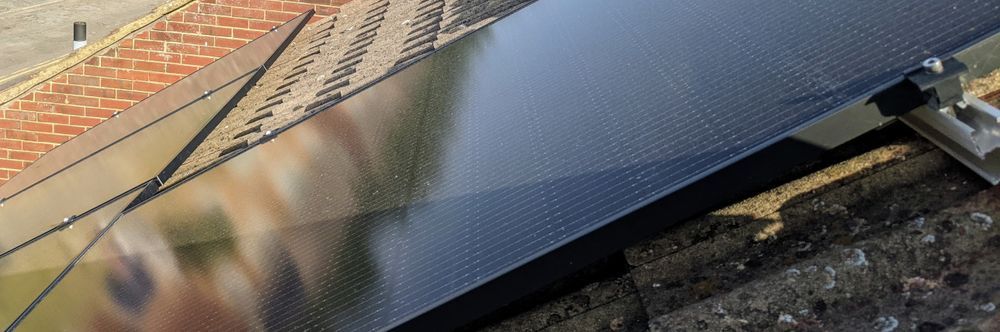
I've got six solar panels installed on a South West facing roof. Six panels gives me a kilo Watt peak (kWp) of 3, so, in theory, I could generate 3kW at any particular moment.
In addition to my solar panels, I've also got three batteries to store extra energy (or energy from the grid during the cheap slot) up to 9.6 kWh. When the sun isn't shining, or the panels aren't generating enough, the batteries should be used before I draw from the grid.
Where's my data coming from?
For electricity generated I'm looking at either the Solis Cloud website, which provides graphs and statistics as sent to it from the inverter, or at the inverter itself.
When it comes to electricity drawn from my supplier, I'm checking my supplier's energy statement for each day. I have noticed that my inverter shows I'm drawing less energy than my energy supplier thinks I'm drawing - I've asked them to clarify why.
The first 60 days
First, let's start with some summary statistics from the first 60 full days (9th June - 7th August 2022:
- Total energy generated: 743.5 kWh
- Lowest daily generation: 5.3 kWh
- Highest daily generation: 17 kWh
- Average daily generation: 12.39 kWh
- Total energy consumed: 741.4 kWh
- Total energy from grid: 195.57 kWh
- Total energy sent to grid: 122 kWh
- Average daily energy to grid: 2.03 kWh
In my first thirty days, despite generating more energy than I've consumed (by 7.5 kWh), I still took energy from the grid. This is likely on ocassions where the load in the house is drawing faster than the solar panels or batteries can provide. Across the first 60 days I consumed 2.1 kWh less than I generated, but don't forget some consumption will have been when the panels aren't generating - that energy will have come from either the batteries or the grid.
Considering my consumption, if I'd been paying for that 741.4 kWh from the grid, assuming everything was charged at my peak price (23.62p / kWh) that would have cost £175.12. Instead I only drew 195.57 kWh from the grid which would have cost £46.19 (at peak price). My supplier bills me a standing charge of 17.41 p / day so those actual costs would have been £10.45 more. From September my standing charge becomes 41.39 p / day and my peak unit price becomes 40.75 p / kWh.
Impact on electricity bills
For the billing period 24th June - 23rd July, my electricity bill was just under £18. Unfortunately I can't do an easy cost comparison with a previous month, due to the seemingly haphazard way my supplier issues statements. That said, looking at 6th May - 23rd May my electricity bill was just over £38, so a shorter period (17 days) cost almost double my month long post solar bill.
- Pre solar cost average (across 17 days): £2.24
- Post solar cost average (across 30 days): £0.60
That's quite a saving.
Note that during those periods I was on a fixed price deal with my energy supplier, so my peak energy price was 23.62p / kWh and off-peak "cheap slot" was 4.76p / kWh. Come September my costs from the grid will increase.
Pay back times
My initial cost for the solar system (panels, inverter, batteries and EV charger) was £9,301. If generation and consumption stays consistent with the first 60 days, I can estimate my return on investment (pay back) times using the figures below. Remember though that in the winter there'll be less electricity generated by the panels each day.
For these calculations I've ignored the standing charge, as my usage has no impact on that.
Consumption - grid draw  (across 60 days)
741.4       - 195.573    = 545.827 kWh

Value of electricity that would have been consumed from grid (across 60 days):
545.827 kWh x £0.2362   = £128.92
So an average daily cost saved of £2.15.
Then we'll take £9,301 and divide it by the average daily cost to get pay back time in years:
Average daily cost across 60 days:
£128.92 / 60             = £2.15

Days at £2.15:
£9,301 / £2.15           = 4,326 days
                         = 11.9 years
At my new fixed term price of 40.75 p / kWh:
Value of electricity that would have been consumed from grid (across 60 days):
545.827 kWh x £0.4075p   = £222.42

Average daily cost across 60 days:
£222.42 / 60             = £3.71

Days at £3.71:
£9,301 / £3.71           = 2,507 days
                         = 6.9 years at new rate
I have not included any income I receive from exporting my energy to the grid, and that will also reduce the pay back time. My current agreement will earn me 4.1 p / kWh that I send to the grid. My current daily average export to the grid is 2 kWh, so I'd be looking at 8.2 p per day. Across the year that's just under £30.
Impact on usage
Now that we're generating our own electricity we've actually seen our electricity usage go up. In part this is because we've switched from heating our water using the immersion heater, rather than gas. Generally we heat the water for one hour a day with a 3 kW heating element, so that immediately added 3 kWh to our consumption.
Conclusion
Assuming I've got my maths right, and so long as my generation remains consistent, with the increasing energy prices I'll have paid back my solar panels in less than seven years. Obviously Autumn and Winter will have a massive impact on generation, so I'll have to revise my figures again later in the year.
Regardless, it seems the investment was a good one.
Banner image: my solar panels.