
Raspberry Pi Zero humidity sensor using MQTT: part 3
How to add the temperature & humidity sensor data to Home Assistant.

After quite a few weeks off to spend time with my family, and studying for my CISSP[0] I'm back with part three.
I've already shown how to assemble the hardware and put the scripts together to publish the data from the sensors. Next we have to get this information to Home Assistant so we can do something useful - that's the topic of this post.
Making the script run automatically
In the last part of this series we wrote the script that queries the sensors, but it was only running on demand (when we ran python3 humidityTemperatureMQTT.py). That's not very practical given we want to get a regular stream of data across to Home Assistant. The easiest solution is to use cron to run the script every 5 minutes. We'll also want to get a reading as soon as the Pi Zero boots (or reboots), something we can also do with cron.
Connect to the Pi Zero using ssh and login as the pi user[1]. Once connected we'll run crontab -e to edit the user's crontab - the file that tells the scheduling daemon [2] what commands to run and how often. Depending on your Linux distribution, the crontab will have a number of comments at the top, lines starting with a #, that explain how things work - worth a read. Importantly for us is the template line that shows us the syntax for the scheduler:
# m h  dom mon dow   command
# minute hour day-of-month month day-of-week command
For this I'm going to assume you've stored your script at /home/pi/kitchenSensors/humidityTemperatureMQTT.py and we want to add these two lines to the file:
@reboot python3 /home/pi/kitchenSensors/humidityTemperatureMQTT.py
*/5 * * * * python3 /home/pi/kitchenSensors/humidityTemperatureMQTT.py
The first line, starting with @reboot, causes our script to run following system start up. Essentially as soon as cron starts running.
In the second line you can see some asterisks * and these mean "every value for this field". For example, a * in the day-of-week field means everyday and a * in the hour field means every hour etc. I want to get a reading from the sensor every five minutes, but rather than listing every 5 minute combination we use some maths to tell cron to run our task every five minutes instead. This is the */5 you can see.
Adding the MQTT integration
MQTT allows our sensor to publish its data to a message topic. Anyone / anything subscribed to that topic will receive a copy of the information and can then process it accordingly. To get Home Assistant to subscribe we need to add an integration:
- Browse to your Home Assistant web page (Lovelace), it'll be something like http://192.168.1.12:8123 [3]
- From the left hand side click Configuration
- Click Integrations
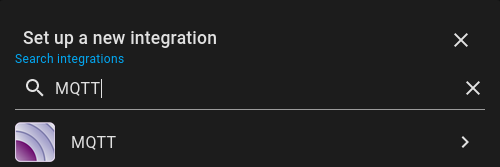
- From the bottom right click the + button to add a new integration
- In the Set up a new integration list that pops up type MQTT in the box at the top
- Click on the MQTT result and follow the on screen prompts
The instructions above assume that you don't have any other MQTT integrations already configured. If you do you'll need to add the sensor queue differently, outside the scope of this guide.
Testing using Home Assistant
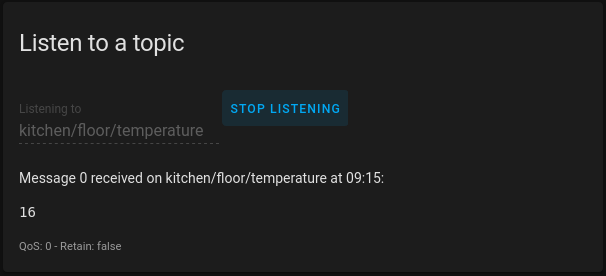
Once the integration is added, we can check that we're receiving data via MQTT by clicking configure on the MQTT integration. Next we put our topic name into the listen to a topic form and click start listening. In my case I put kitchen/floor/temperature in the box and you can see a reading is shown underneath:
Monitoring the sensors
At the moment Home Assistant knows about the MQTT broker running on the Pi Zero (because of the integration) but isn't subscribed to any topics. For that we'll need to edit some YAML in a text configuration file. Using the File Editor plugin open your configuration.yaml file and add the relevant config. Note that indentation matters!
- platform: mqtt
    state_topic: "kitchen/floor/temperature"
    name: Kitchen floor temperature
    unit_of_measurement: '°C'

  - platform: mqtt
    state_topic: "kitchen/floor/humidity"
    name: Kitchen floor humidity
unit_of_measurement: '%' I've got three DHT22 sensors to monitor so I've got three sets of the above, one for each sensor. It's important to specify the unit of measurement otherwise the data doesn't graph as well, covered next.
Doing something!
Home Assistant's lovelace dashboard has a built in graph history card that we can use to create graphs of our sensor data over time. To add one, simply edit your dashboard, click the + button bottom right and choose the history graph card (highlighted):
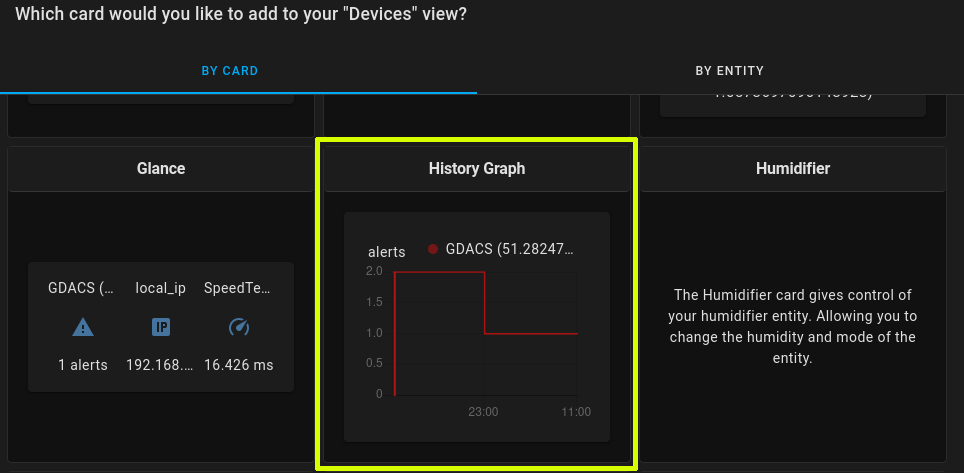
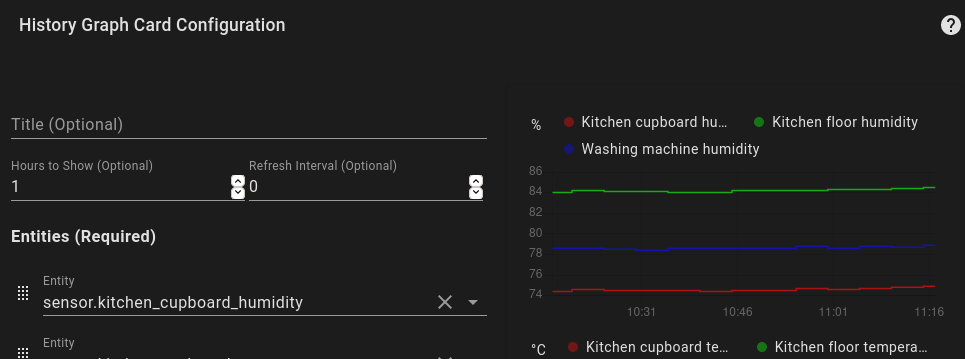
Next we tell the card what entities to place on the graph. In our case every entity starts with the word sensor so we can filter the list by typing sensor into the entity box. Once that's done we'll end up with six entries and a preview of the graph, like below:
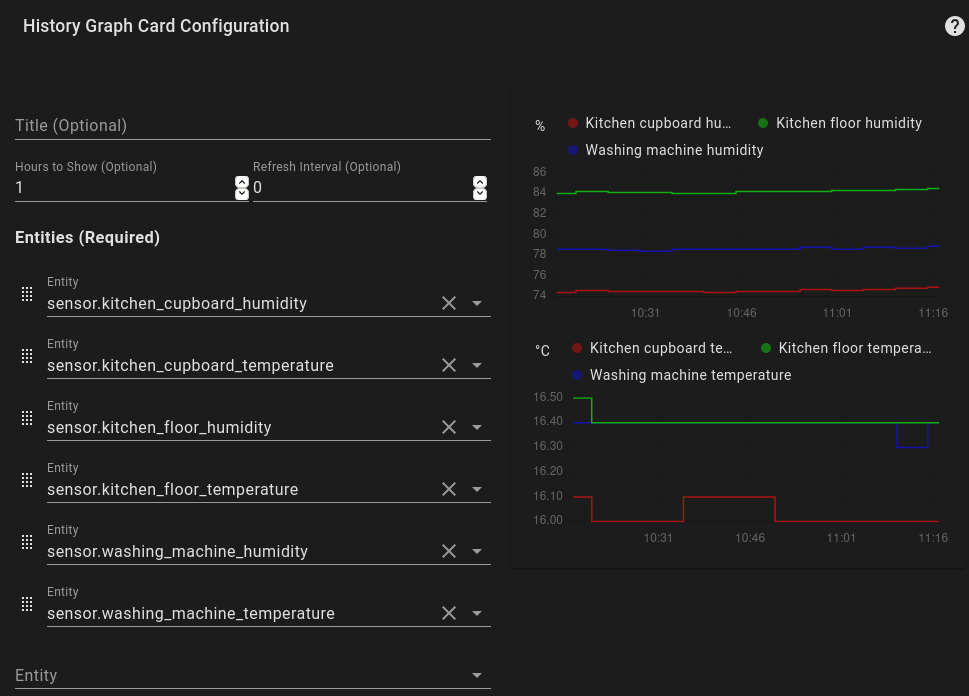
This is only possible because we specified the unit_of_measurement earlier, otherwise our entities would all be on the same graph and would have little context.entities
The code configuration for my card is shown below:
entities:
  - entity: sensor.kitchen_cupboard_humidity
  - entity: sensor.kitchen_cupboard_temperature
  - entity: sensor.kitchen_floor_humidity
  - entity: sensor.kitchen_floor_temperature
  - entity: sensor.washing_machine_humidity
  - entity: sensor.washing_machine_temperature
hours_to_show: 1
refresh_interval: 0
type: history-graph
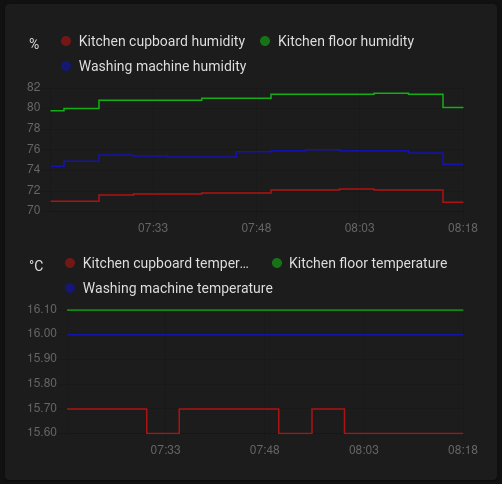
Having watched the graphs for a bit, and found the massive variance on the humidity sensor, I called a halt to the project at this point. Further research showed there were leak detectors that based their alerts on electrical conductance, not humidity, which seem to be more reliable. I'll get a few of those and join them to Home Assistant. The end goal is to receive email alerts when there's a leak so we can do something about it.
What's next?
Unfortunately I've found that the DHT22 humidity readings are horribly inaccurate. For example, with all three sensors in the same space, within about an inch of each other, my readings are 70.9%, 74.6% and 80.1%. The temperature readings seem to be pretty good though (15.6°, 16°, 16.1°). I think what I'll end up doing is making a leak detector with an ESP Home board (more research needed) and using the Pi Zero and temperature sensors for something else - possibly automating the guinea pig hutch heater over Winter.
Banner image: Screenshot of the history card configuration.
[0] The (ISC)2 Certified Information Systems Security Professional (CISSP) is a well regarded security qualification. I passed the exam on 12th September 2020 - more on that another time.
[1] Obviously you can use a different user, but pi is almost guaranteed to be on the Pi Zero. Changing the user is outside the scope of this post.
[2] On Linux and Unix, a program that runs in the background is a daemon, these are the same in concept as services in Windows.
[3] If you followed my steps on configuring HTTPS in this post then you'll need to use https://.